In the previous episodes, we explored how, despite the expansion in departments, products, and customer growth in 2017, the quantity sold was lower than in 2015, and profit remained nearly the same. We also analyzed key metrics such as the difference between net sales and gross sales, profit, and profit margin, along with the departments net sales.
In this episode, we will introduce trend analysis, focusing on two key perspectives: relative change and absolute change. This will help us compare 2015 and 2017 to understand what went wrong and uncover key insights.
1. Relative Change
Let’s start with relative change, which measures the percentage difference between two values to show proportional growth or decline over time.
The formula is:
Relative Change:
This helps us compare 2015 and 2017 by analyzing how key metrics like sales, profit, and quantity sold have changed in percentage terms.
2015
2017
Transactions Percentage Change:
The 4.4% increase in transactions indicates positive growth, suggesting improved customer engagement or a successful sales strategy.
Quantity Sold Percentage Change:
The -23.36% decrease in quantity sold points to a significant drop in sales volume, indicating potential issues with demand or market conditions.
Net Sales Percentage Change:
The –4.32% decline in net sales suggests challenges with pricing, product mix, or customer spending behavior despite increased customer acquisition.
Profit Margin Percentage Change:
The 3.36% increase in profit margin indicates improved profitability, suggesting better cost management or pricing strategies.
2. Navigating DAX
Net Sales Percentage Change = DIVIDE( [Current Net Sales] – [Previous Net Sales], [Previous Net Sales] ) * 100
The DIVIDE function divides the first argument by the second argument.
The comma in the DIVIDE functionseparates the numerator and the denominator:
Numerator:[Current Net Sales] - [Previous Net Sales] — the difference between the current and previous net sales.
Denominator:[Previous Net Sales] — the value you’re dividing by.
* 100: After the division, we multiply the result by 100 to convert the result into a percentage.
Positive Aspects
The increase in profit margin and transactions are good signs. The business was able to generate more revenue per transaction (profit margin) and saw an increase in the number of transactions. These factors show that the business is managing to improve in some areas, despite challenges in others.
Challenges
The decline in quantity sold, along with the decrease in net sales, suggests that while there may be more transactions, customers might not be buying as much per transaction, or the overall volume of sales has dropped. The drop in quantity could indicate a need to reconsider product offerings or pricing strategies.
3. Absolute Change
To understand the factors driving changes in net sales, we will use absolute change, which measures the actual difference between values. It is calculated as:
Absolute Change = Final Value – Initial Value
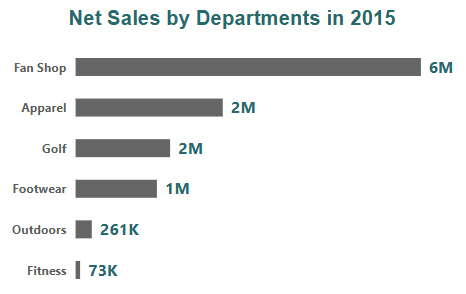
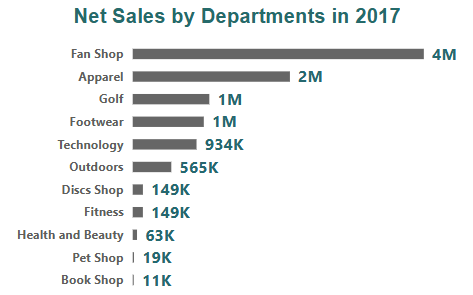
We will compare net sales across departments between 2015 and 2017 to identify top-performing departments that may have declined or disappeared. This insight will guide adjustments to product offerings, focusing on departments needing revitalization.
Fan Shop Change:
$4M – $6M =-$2M
Outdoors Change:
$565k – $261k = $304k
Fitness Change:
$149k – $73k = $76k
Despite the expansion of departments and products in 2017, the Fan Shop’s sales saw a significant decline of –$2M (from $6M in 2015 to $4M in 2017), which greatly impacted the overallnet sales for the year.
While new departments like Technology performed strongly and became top performers, their success couldn’t fully offset the loss from Fan Shop, highlighting the department’s substantial influence on the overall results.
What caused the drop in net sales?
Was it the pricing strategy, or did certain products in the Fan Shop no longer appeal to customers? Was the addition of more departments and products in 2017 a factor in the removal of other products, affecting the Fan Shop’s offerings? These are important questions to explore in understanding the key drivers behind the drop in sales.
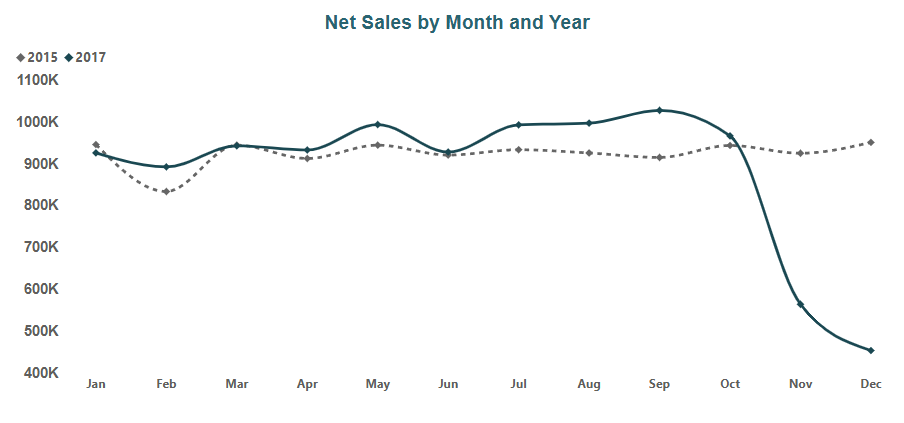
4. Monthly Sales Overview
Comparing the monthly net sales of 2015 and 2017 will help identify trends, seasonal shifts, and potential impacts of new departments on Fan Shop sales.
We observe a significant drop in sales during November and December.
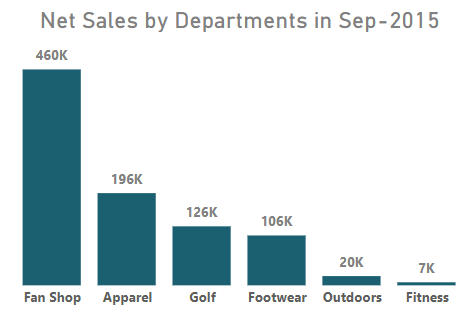
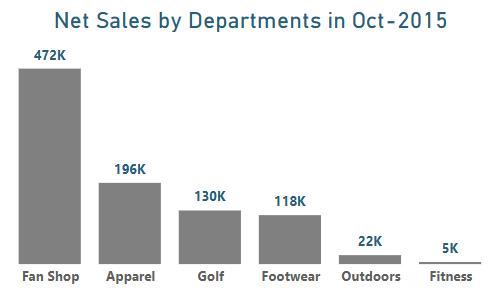
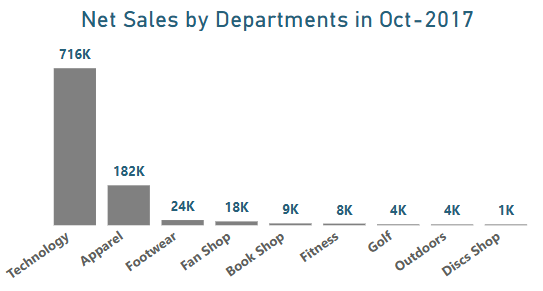
To further analyze the decline, let’s examine net sales by department from September to December in 2015 and 2017. This will help identify which departments contributed to the drop.
All departments net sales in 2017 were higher than in 2015, indicating that the expansion of departments in 2017 successfully attracted more sales.
All departments that generated sales in 2015 experienced a drastic drop in 2017, with the Fan Shop seeing a significant decline, dropping from $472,000 in 2015 to just $18,000 in 2017. However, the technology department stood out, generating the highest sales with $716,000 in 2017.
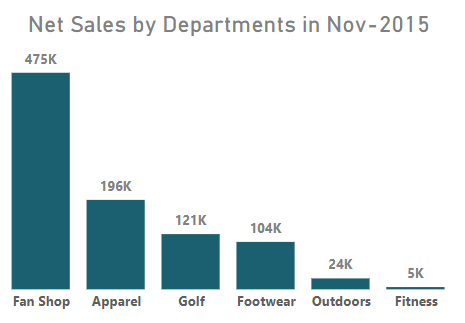
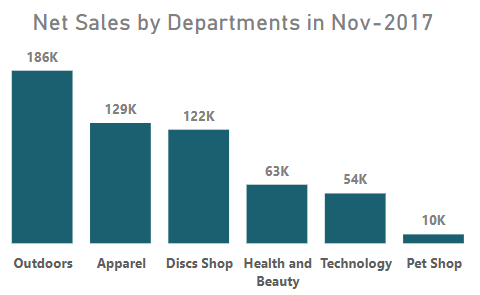
In 2017, most of the departments that generated sales in 2015 disappeared, while the Outdoors department saw an increase in net sales. However, the heavy reliance on the new departments negatively impacted overall sales.
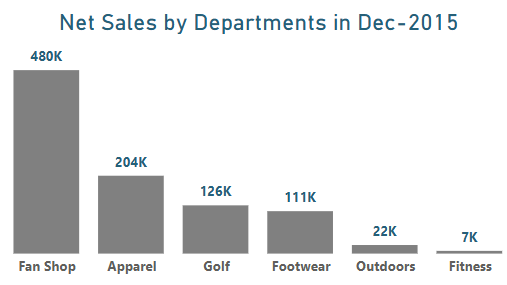
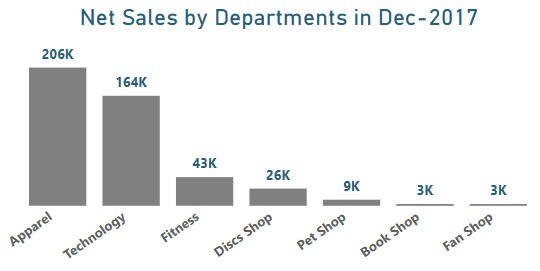
The Fan Shop department’s net sales dropped significantly, from $480,000 in 2015 to just $3,000 in 2017. Meanwhile, the Apparel and Fitness departments saw an increase in sales, while all other departments were newly introduced during this period.
TheFan Shopdepartment played a significant role in overall net sales, and its disappearance contributed to a substantial decline in total revenue. The Apparel department, however, maintained consistent sales, demonstrating stability over time.
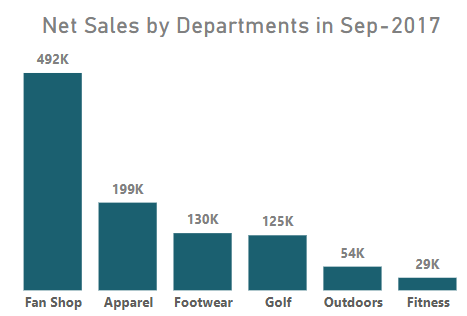
The introduction of the Technology department had the most significant impact, driving massive net sales, particularly in October, where it became the top-performing department. This suggests that the Fan Shop, Apparel, and Technology should be the primary focus. Reviving the Fan Shop could help recover lost sales, Apparel’s steady performance makes it a reliable revenue source, and Technology’s strong sales potential indicates that it should be further expanded to maximize growth.
In the next episode, we’ll explore other factors that either enhance or hinder our clients’ experience with us.