In this episode, we’ll explore cohort analysis to better understand customer retention and department growth. Simply tracking totals over time can be misleading, so we’ll group customers by their first purchase year to reveal engagement trends. We’ll also apply this approach to departments and products to track their expansion more accurately.
Embark on this voyage with us and uncover how cohort analysis can chart the course for deeper business insights and growth!
1. Customer Cohort Analysis
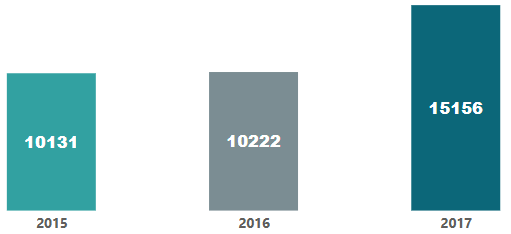
Let’s start by looking at the total number of customers we had each year.
This visual gives us an overview of customer growth year over year. However, simply knowing the total number of customers doesn’t provide us with the full picture of customer retention—we need to understand how many of them are returning customers and how long they stay engaged with us.
Let’s dive deeper into how cohort analysis can provide insights into customer retention.
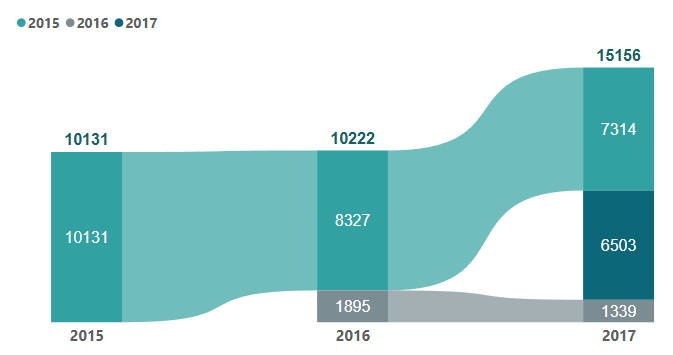
By grouping customers based on their first purchase year, we can track how many customers stay active over time.
This is critical for measuring how well we are retaining our customers and how many new customers are joining year after year. For example:
In 2015, we had 10,131 customers.
In2016, we retained 81% of those customers, meaning 8,327 customers were still active from 2015, while 1,895 new customers joined. This means that 19% of the customers in 2016 were new, showing us the impact of customer retention.
Moving into 2017, we retained 72% of our 2015 customers (7,314 customers) and 16% of our 2016 customers (1,339 customers).
In total, 6,503 new customers joined in 2017, which accounts for 40% of the total customer base in 2017, indicating a strong influx of new customers while maintaining solid retention.
YEAR: Extracts the year from a date. In this case, it takes the minimum order date (calculated by MIN) and returns the year of that date.
MIN: Finds the smallest value in a column, in this case, the earliest (minimum) order date for each customer.
CALCULATE: Changes the context in which the calculation (MIN) is evaluated. It allows you to apply additional filters or modify the existing ones.
ALLEXCEPT: Removes all filters except the one specified—in this case, the ‘Customer Id’. This ensures that the MIN is calculated separately for each customer, ignoring other filters.
As we saw shifts in customer retention and an increase in new customers in 2017, it’s essential to explore whether this growth impacted the business structure.
Did new demand lead to new product categories? Were existing departments expanding?
To answer this, we analyze department and product cohorts.
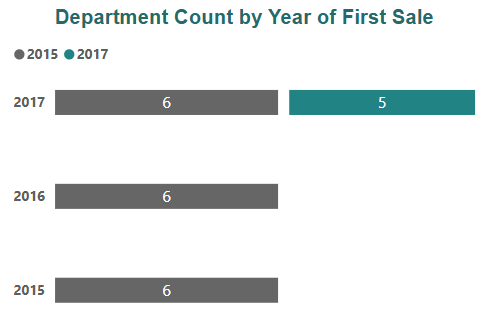
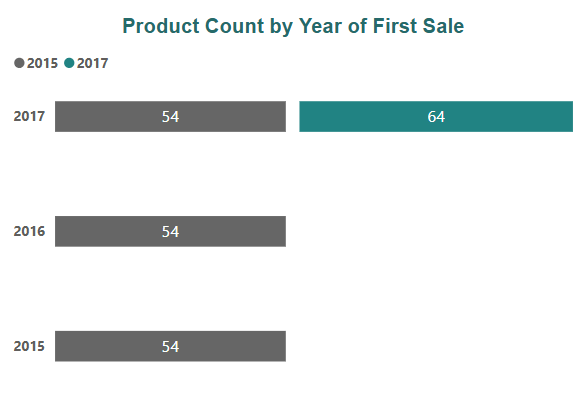
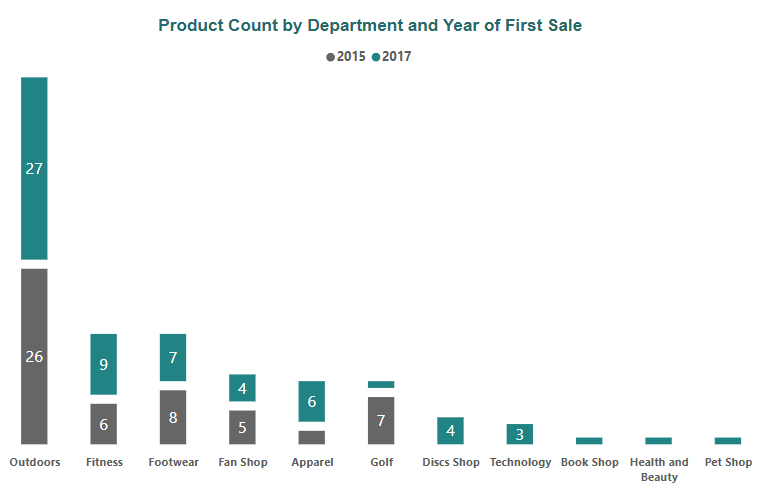
In 2015, there were 6 departmentsand 54 products.
No new departments or products were added in 2016.
In 2017, 5 new departments were introduced, and 64 new products were added.
Did the 64 new products in 2017 come exclusively from the 5 newly introduced departments, or were they strategically spread across both new and existing departments to boost overall growth?
We’ve explored how the business expanded with new departments and products over the years. However, growth isn’t just about adding more—it’s about performance. Some departments contributed significantly to net sales, quantity sold, and profit, while others had a smaller impact.
Interestingly, only 10 of the 64 new products were assigned to the 5 new departments, while the rest were spread across the existing departments from 2015, showing a strategic approach to growth.
In the next episode, ‘Star Departments’, we’ll dive into key metrics like net sales, quantity sold, and profit to pinpoint which departments truly lead the way.